Using Jenkins' Plot plugin to graph data
Using Jenkins to run periodic tasks, we might end up with useful data we’d like to see over time.
If you have Jenkins running, you can create an example job called “plot test”, add an “execute shell” build step, with the following code which prints a random number between 1 and 10:
X=$(date +%s); echo $(( ( $X % 10 ) + 1 ))
Now if we run this job several times, each console output will look like this:
+ X=1680013637
+ echo 8
8
Finished: SUCCESS
and
+ X=1680013624
+ echo 5
5
Finished: SUCCESS
etc.
Install the Plot plugin
So what if we want to plot these numbers on a graph over time? This is where the Plot plugin comes in.
If you go to /manage/pluginManager/available, and search for “Plot”, you should be able to install the Plot plugin. You can select “Install without restart”.
Put your data in a csv file
Go back to your job, and, instead of echoing the random number to console, put the random number in a csv file:
set -e
DATE=$(date +%s);
RAND=$(( ( $DATE % 10 )  + 1 ))
echo "random" > rand.csv
echo "$RAND" >> rand.csv
Set up the Plot plugin in your job
In your job’s “Post-build actions”, select “Plot build data”.
- Set Plot group to “Random numbers”
- Set Data series file to “rand.csv”
- Select “Load data from CSV file”.
Test the plot
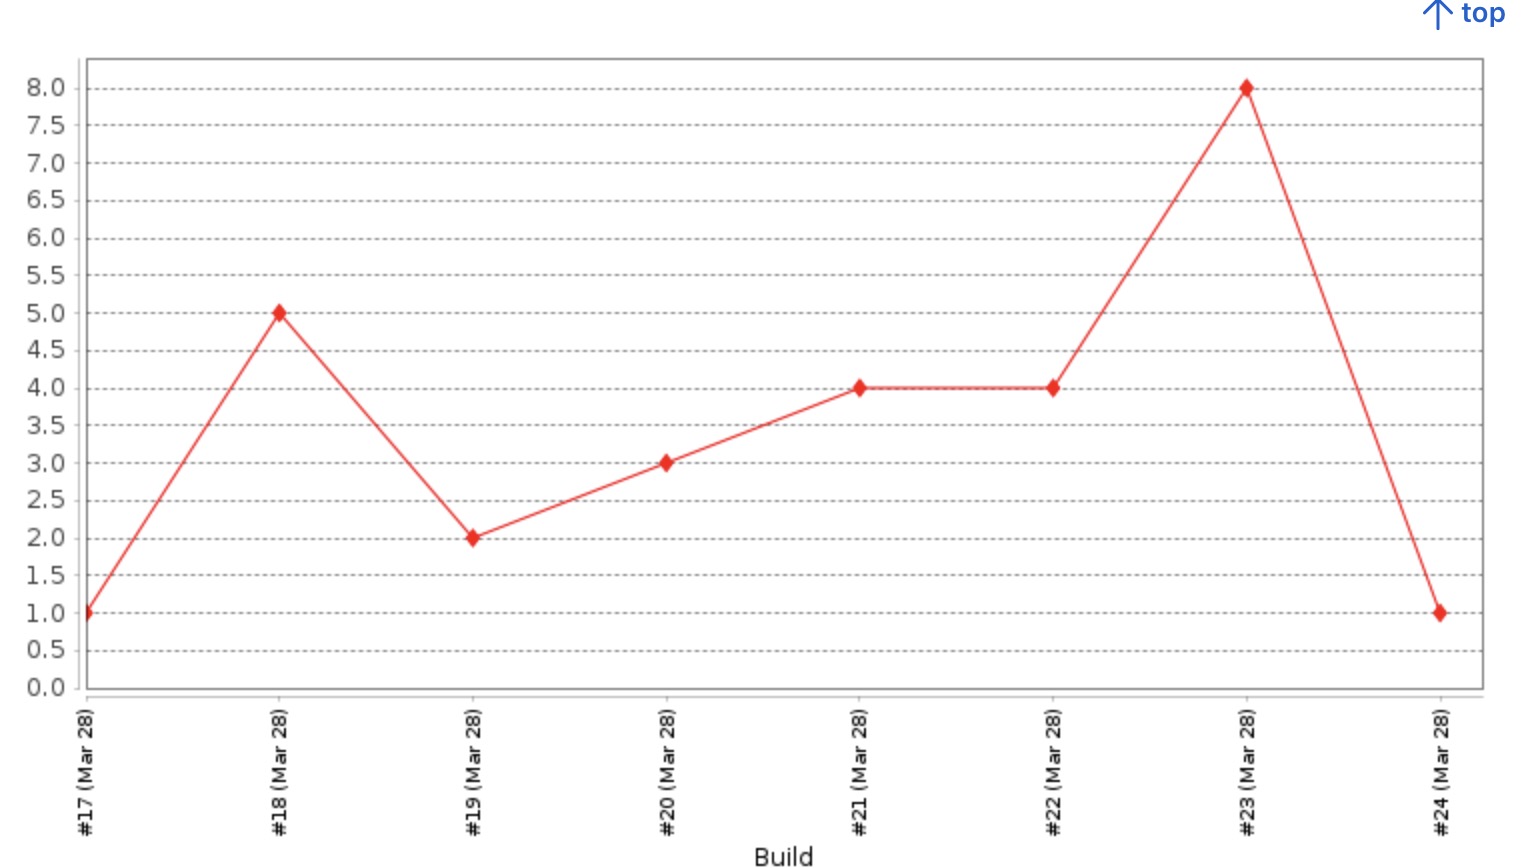
Save and run your job several times. Select “Plots” in the sidebar and you should be seeing something like this:

Multiple numbers
Modify your job to have two random numbers:
set -e
DATE=$(date +%s);
RAND=$(( ( $DATE % 10 )  + 1 ))
RAND2=$(( ( $DATE % 20 )  + 1 ))
echo "random,random2" > rand.csv
echo "$RAND,$RAND2" >> rand.csv
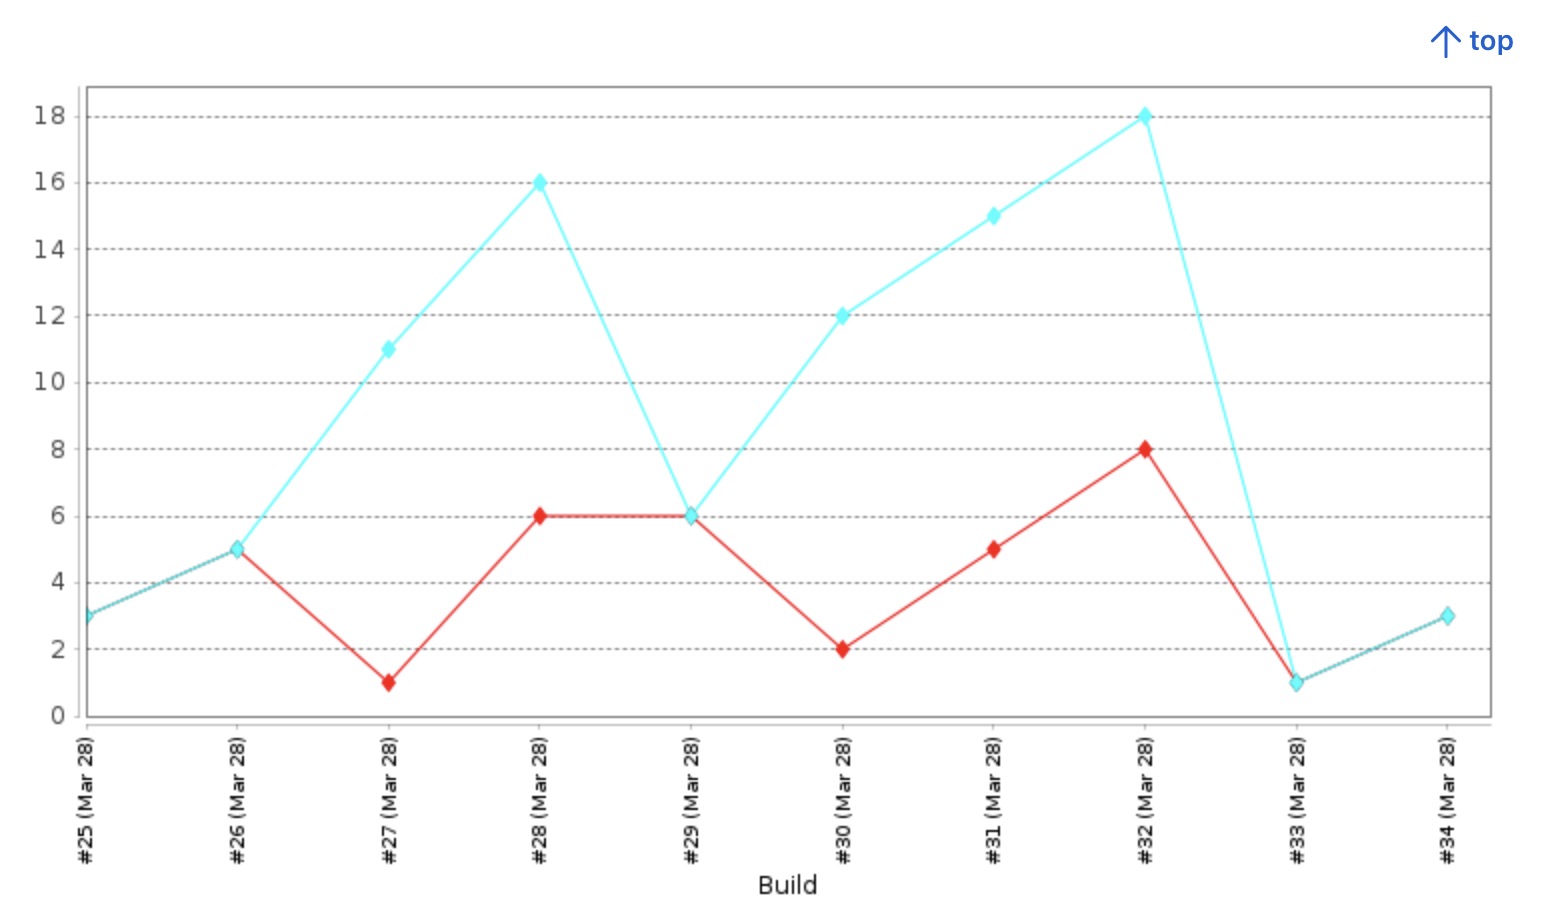
Run your job several times, and now you should be seeing something like this in the Plot section:
